Engineering 44

Engineering 44

Monday, March 30, 2015

Inverting Voltage Amplifier Lab

Today in lab we experimentally created a circuit that multiplied an input voltage by a negative constant, using a operational amplifier. The operational amplifier that we used was an OP27, and by connecting our power into the "-" input pin of the op-amp, we were able to invert the sign of the voltage. Also, by looping the output back to the input, we were able to manipulate the ratio of the magnitude of the output to the input. The circuit we built looked as follows:
^^^^ A downward arrow indicates ground ^^^^

The relationship between the Vin and Vout for the circuit is as follows, according to Ohm's law:

We wanted to create a gain of approximately negative 2, with an input resistance, R1, of 1.8K Ohms. In order to do that, we needed to use a loop resistance, R2,  of 3.6K Ohms, then test the circuit with a Vin range of (-3V, 4V). Below is the work that we did to design and analyze the theoretical circuit (using a value of 2K Ohms, for ease of calculation) :


We then began building the circuit:

^^^^ Measured resistances of the 1.8K Ohm resistor (Left), and 3.6K Ohm resistor (Right) ^^^^


^^^^ The constructed circuit, ready for testing ^^^^

With the circuit constructed, we began testing the circuit by varying the input voltage from -3V to +4V in 0.5V increments. The results are numerically and graphically represented below:


As the data suggests, the circuit behaved as expected, but with limitations; the Vout never went above a magnitude of 4.25V due to power loss within the system, as well as power supply limitations. Additionally, the op-amp only behaved as expected for a short period of data. From input voltages of ~ -2V to ~1.5V the output was very close to a -2 multiple. Beyond that range though, the op-amp couldn't provide the desired output due to saturation within the op-amp itself. That being said, it should be noted that whenever using an op-amp, you should aim to operate between its saturation values.

Non-Ideal Power Sources

Today in class we did an experiment that explored the shortcomings of real-life power sources in comparison to the ideal power sources that we usually model circuits with. True power sources both have an internal resistance, and a maximum amount of power that they can produce. Ideal power sources that we model circuits with have no such limitations. The lab today was designed to explore those issues.

By modeling a simple circuit with a single DC power source, connected to a single resistor, and then measuring the voltage drop across the resistor, we were able to easily compare an ideal circuit to a true-to-life circuit.
^^^^ Schematic of the circuit with the ideal power source ^^^^


The circuit that we analyzed had a 1V power source connected to a 22 Ohm resistor. By Ohm's law, analysis of the ideal circuit yields an expected voltage drop across the resistor of 1V, an expected current of .045 Amps, and a power dissipation of .045 Watts.


However, analyzation of the non-ideal circuit yields an additional internal resistance of the power supply and the wiring, which we denoted Rs.

^^^^ Schematic of the circuit with the non-ideal power source ^^^^


According to Ohm's law, the new Vout, Source Current, and Power across the resistor would be:


With those values predicted, we then collected all the elements of the circuit and constructed it.

The 22 Ohm resistor was measured at  24.1 Ohm plus/minus .3 Ohms.

^^^^ The picture shows a higher level of resistance due to a poor connection within the wires ^^^^

We then set the Wave Gen to exactly 1.00V by measuring it with a voltmeter, and adjusting it until it was at the exact output voltage value. With that completed, we measured the voltage drop across the resistor, as well as the current through the resistor.


^^^^ Left: The current through R. Right: Preparing to measure Vout ^^^^


We ended up recording a .977V drop across the resistor, with a current of 34.5 mA. Using Ohms law, that equates to a power dissipation rate of .0337 Watts. Obviously, those numbers don't match our ideal predictions, so the circuit must be non-ideal. Utilizing the equations above, we were able to calculate an internal resistance of .667 Ohms within the power supply.

While that appears to be somewhat definitive of the internal resistance, we decided to redo the lab with both a 39 Ohm resistor and a 10 Ohm resistor, separately, in order to get more accurate data.

By the same methods outlined above:

Circuit with 39 Ohm resistor :                                      Circuit with 10 Ohm resistor:
Expected Vout = 1V                                                     Expected Vout = 1V
Expected source current = 25.6 mA                             Expected source current = 100 mA
Expected power dissipation = .0256 Watts                  Expected power dissipation = .100 Watts


Measured resistance of resistor = 41.6 Ohms              Measured resistance of resistor = 12.0 Ohms

Experimental Vout = .992V                                        Experimental Vout = .562V
Experimental source current = 23.1 mA                     Experimental source current = 44.6 mA
Experimental power dissipation = .0229 Watts          Experimental power dissipation = .0251 Watts
Calculated Rs value = .346 Ohms                               Calculated Rs value = 9.82 Ohms

As the data suggests, there is definitely an internal resistance associated with the power supply. What's surprising though, is that the resistance value appears to vary based on the circuit. This of course isn't true, but what is more than likely the case is that the internal resistance just has a much larger impact on circuits with very little resistance. That being said, labs done in the future should be done using much larger levels of resistance in order to minimize the effects of the internal resistance.

Sunday, March 29, 2015

Thevenin's Theorem Lab

Today in class we did the Thevenin's Theorem Lab; the purpose of this lab was to experimentally evaluate Thevenin's theorem, and confirm its claims. This was done by using Thevenin's theorem to analyze a circuit and predict a certain voltage across a resistor that will result from adding the resistor to the circuit. Then, once it was analyzed, we built the circuit, added the resistor and measured the voltage across it. After that, we constructed the Thevenin equivalent of the circuit and connected the resistor to it and measured its voltage, which we compared to the results of the original circuit. Lastly, we varied the value of the load resistance and measured the power across the resistor to confirm the maximum power transfer theorem.


We began by analyzing the circuit using Thevenin's Theorem. The circuit can be seen in the upper left of both of the pictures below.


^^^^ Left: Thevenin resistance calculations Right: Thevenin voltage calculations ^^^^

Thevenin Equivalent Resistance across AB: 7.35K Ohms
Thevenin Equivalent Voltage across AB: 0.463V 

With that completed, we measured the resistances of all resistors and the potentiometer.
6.8K Ohm #1: 6.68K
6.8K Ohm #2: 6.62K
4.7K Ohm     : 4.68K
2.2K Ohm     : 2.16K
1.0K Ohm #1: .998K
1.0K Ohm #2: .998K
1.3K Ohm     : 1.30K
10K Ohm      : 9.93K
8.2K Ohm     : 8.11K
10K Ohm Pot: 9.26K

We then built the complete circuit, but left out the resistor labeled RL in the diagram, and measured the voltage/resistance across points A and B in the diagram.


^^^^ Left: The voltage across AB (hooked up backwards). Right: A closeup of the circuit ^^^^


^^^^ Another view of the completed circuit ^^^^

Voltage across AB without RL      : .455V
Resistance across AB without RL : 7.27K Ohms

Expected Values: .463V and 7.35K Ohms.

As you can see, the experimental values were both incredibly close to the expected values; the voltage varied by 1.73% and the resistance varied by 1.09%. 

After that we connected the 8.2K Ohm resistor across AB and found the voltage across it to be 56.5 mA which is once again quite close to what we were expecting.

Finally, we took the potentiometer, set it to 7.37K Ohms (to imitate the circuit) and connected it to the 8.2K Ohm resistor. Once again we measured the voltage across the resistor and found it was 53.7 mV. That confirms that Thevenin resistance can be calculated and used to replace complicated circuits, when you want to change only one aspect of the circuit.


^^^^ Replacing the circuit with a potentiometer and measuring the voltage across the 8.2K Ohm Resistor ^^^^


Time-Varying Signals Lab // BJT Curve Tracer Lab

Today in class we did two labs -- Time-Varying Signals, and BJT Curve Tracer. I will begin with the Time-Varying Signals Lab. 

Time-Varying Signals Lab:
Often times, circuits will have capacitors (as well as other means of storing electrical energy) which tend to behave very differently in direct current circuits than they do in alternating current circuits. To ensure that we're probably equipped to begin analyzing such circuits we did the Time-Varying Signal Lab; it taught the basics of how current and voltage across resistors fluctuate with time in alternating current circuits. We began by analyzing how a circuit of two identical resistors in series would behave in an alternating current. It was theorized that the voltage across the second resistor would be equal to exactly half of the input voltage of the circuit, and that it would fluctuate in time just as the current did. This is our group's graphical representation of that:


We then constructed the circuit and tested our theory:

^^^^ The two 6.8K Ohm resistors used to construct the circuit ^^^^


^^^^ The constructed circuit, ready to be tested ^^^^
***We actually didn't use the DMM to analyze the circuit. We used the oscilloscope of the Digilant lab tool, which is not pictured, but was connected in the exact same fashion as the DMM***

By connecting our circuit to a 2V, 2kHz sinusoidal current, a a 2V, 1kHz sinusoidal current, and a 4V, 100Hz triangular current, and then analyzing the output voltages with an oscilloscope, we were able to test our calculations. The results for each time-varying current pattern were as follows:


As the screenshots show, our predictions matched the true outcomes very closely. As a result, it is safe to say that output voltage in circuits containing alternating currents can be calculated using simple algebraic expressions that are functions of time.


BJT Curve Tracer Lab:
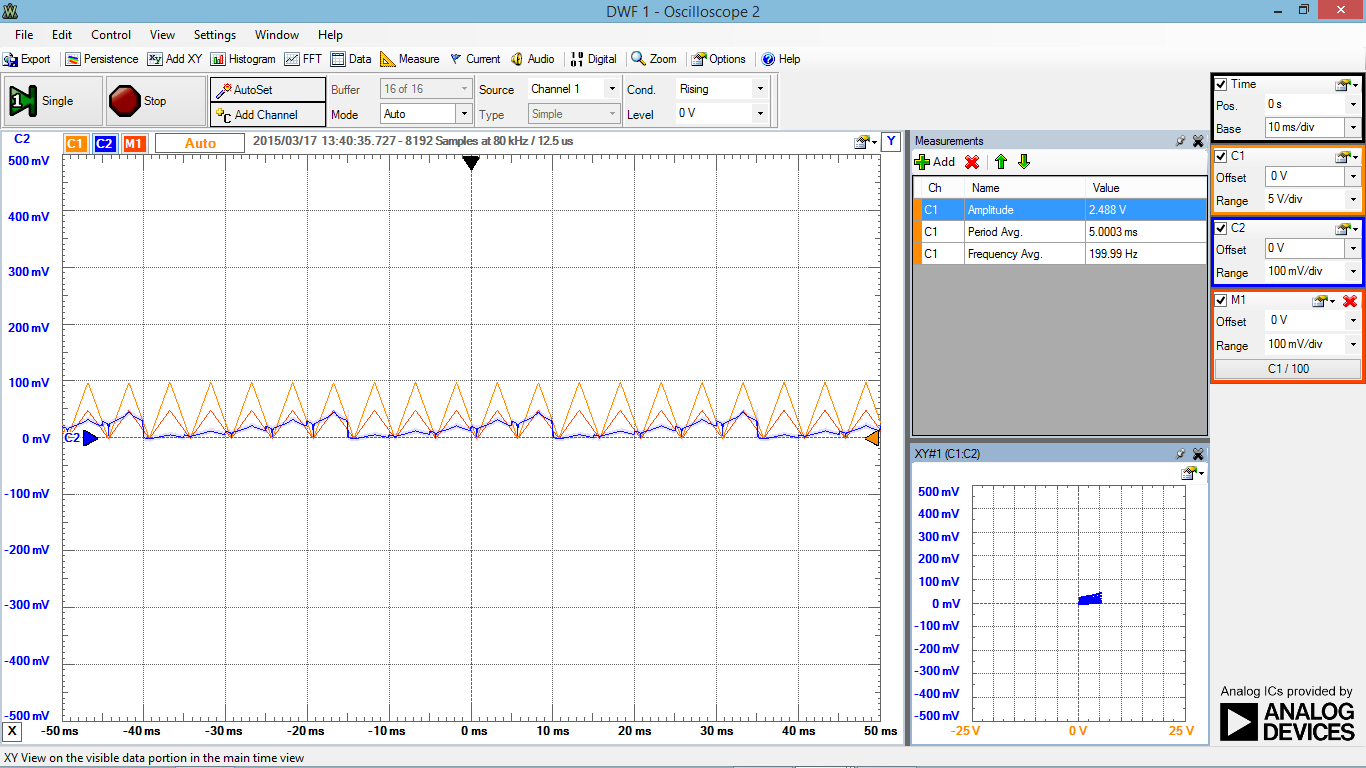
The second lab that we did in class today was an experiment designed to investigate the gain of a 2N3904 NPN transistor. By measuring the collector current vs. the collector voltage across different input voltages (by means of an oscilloscope), the gain was hoped to be experimentally determined. We hoped to utilize time-varying currents to gain accurate information about the gain across several different levels of current and voltage. After having tested the BJT, we then looked up the BJT's fact sheet, and compared the experimental values to the expected values to determine our precision within the experiment.


^^^^ Left: Resistance of the 100 Ohm Resistor. Right: Resistance of 100K Ohm Resistor ^^^^


^^^^ The constructed circuit, ready to be analyzed ^^^^


Monday, March 16, 2015

MatLab

The following are my results for the circuit analysis:


Mesh Analysis III / Quiz 2

Quiz:

We began the class session with a quiz; the following is my table's attempt at solving it:


Mesh Analysis III Lab:


Today we did a lab based on circuit analyzation using the method of Mesh Analysis. Circuits containing several power sources can be incredibly difficult to analyze if done incorrectly, so this lab aimed to illustrate the usefulness of Mesh Analysis. We first analyzed a given circuit (pictured below) and solved for I1 and V1, then we built the circuit and experimentally determined their values. This is the circuit that we analyzed and constructed:


This is our analysis work using the method of Mesh Analysis:


Predicted values based on Mesh Analysis:
I1: -.260 mA
V1: 2.46 V

We then measured the resistance of all required elements of the circuit, constructed the circuit, and then measured the sought after values. The results were as follows:


^^^ Measured Resistance for the 1.8K Ohm Resistor ^^^


^^^ Measured Resistance for the 4.7K Ohm Resistor ^^^


^^^ Measured Resistance for the 6.8K Ohm Resistor ^^^


^^^ Measured Resistance for the 22K Ohm Resistor ^^^

^^^ Close-ups of the constructed circuit ^^^


^^^ Left: The measured voltage V1.    Right: The measured current I1. ^^^

Measured values:
I1: .260 mA
V1: 2.45 V

% Difference between the theoretical value of I1 and the measured value: 0%
NOTE: Although .260 mA was measured instead of -.260 mA, the answers are still the same; we simply switched the orientation of the leads on our voltmeter.

% Difference between the theoretical value of V1 and the measured value: .41%


As the data suggests, Mesh Analysis proved to be a tremendously effective and easy way to analyze circuits with several power sources. This proves to be the second simple way to analyze circuits of this nature that we've covered in class.


Nodal Analysis 1

The purpose of this lab was to design, build, and analyze a circuit with several power sources via Nodal Analysis. Once the circuit was built, it would then be compared to our theoretical analysis of said circuit. The importance of this lab to illustrate the value of Nodal Analysis in the case of several power sources within a single circuit. The following is the circuit we analyzed, and immediately after it is the work that we did using Nodal Analysis to determine the voltages across v1 and v2:
As the work illustrates, the expected voltages were as follows:

V1: 2.425 V
V2: 4.425 V


We then constructed the circuit, as well as measured the resistance of all elements that were used to construct the circuit:


Measured Resistances: 
Measured resistance of the 22K Ohm resistor: 21.9K Ohms
Measured resistance of the 10K Ohm resistor: 9.92K Ohms
Measured resistance of the 6.8K Ohm resistor: 6.76K Ohms

NOTE: It should be noted that all values of resistors were within .8% of their anticipated values, so the margin of error within the voltages was expected to be low.


We then used to Waveform software to determine the voltages across V1 and V2:


^^^^^ The measured voltage across V1 was 2.434 V ^^^^^^


^^^^^ The measured voltage across V2 was 4.372 V ^^^^^^


% Difference between anticipated Voltage and actual Voltage across V1: 0.37% Difference
% Difference between anticipated Voltage and actual Voltage across V2: 1.24% Difference

As the data suggests, the measured values of voltage across V1 and V2 were quite close to the theoretical values. This clearly illustrates the usefulness of Nodal Analysis to dissect difficult circuits involving multiple power supplies. It eliminates the need to necessarily build them to determine their attributes.